The real explanation for Brexit and Trump
Photo: Suzanne Cordeiro / AFP / Getty Images
When it comes to political shocks, 2016 will be remembered as a monumental year. In June, Brits voted to “take back control” and leave the European Union. In November, Americans elected Donald Trump to “make America great again”.
Much has been written about the supply side of populism; the demagogic appeal of Trump and Leave, but what of the other side? What is driving the search for populist solutions from the voters’ point of view? And will these forces be significant enough to mould politics in their own image in the years ahead?
Taking a deep-dive into the data from the votes for Brexit and for Donald Trump highlights that they were driven by similar factors. In both countries, increasing geographical polarisation has trapped certain demographics stagnating in areas where they have been denied the social, educational and economic opportunities that many people elsewhere now take for granted.
A mixture of economic, cultural and political factors are important for explaining the political earthquakes. Both votes were political statements by people living in places where politics and politicians passed them by, without political opportunities to register the lack of cultural, economic and educational prospects until Brexit and Trump came along.
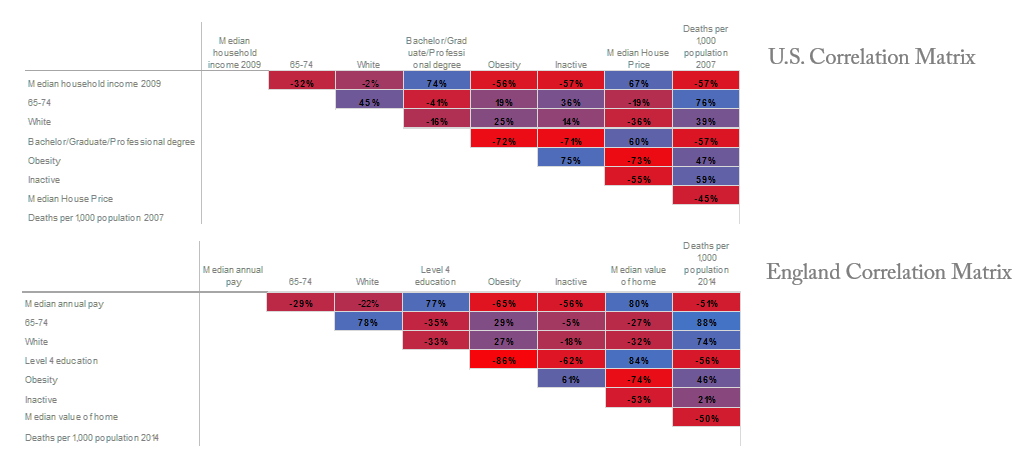
The key drivers were a common set of variables relating to health, wealth, education and ethnicity, which are highly correlated to one another in the US and England, as the correlation matrices below highlight (Figure 1).
The higher the number, the stronger the association between the two variables. Whether the number is positive or negative reflects the direction of the relationship. For instance, higher education is strongly related to higher household income and is also strongly related to low levels of obesity.
Figure 1. Drivers of populism in the US and England
While each of these variables has predictive power on its own, it is when they are considered all together that we can best explain the drivers behind support for Trump and Brexit.
One way to simplify how all of these variables interrelate to one another is to collapse them into one structural component which indicates the degree of social and economic decline of an area – a “left behind” factor.
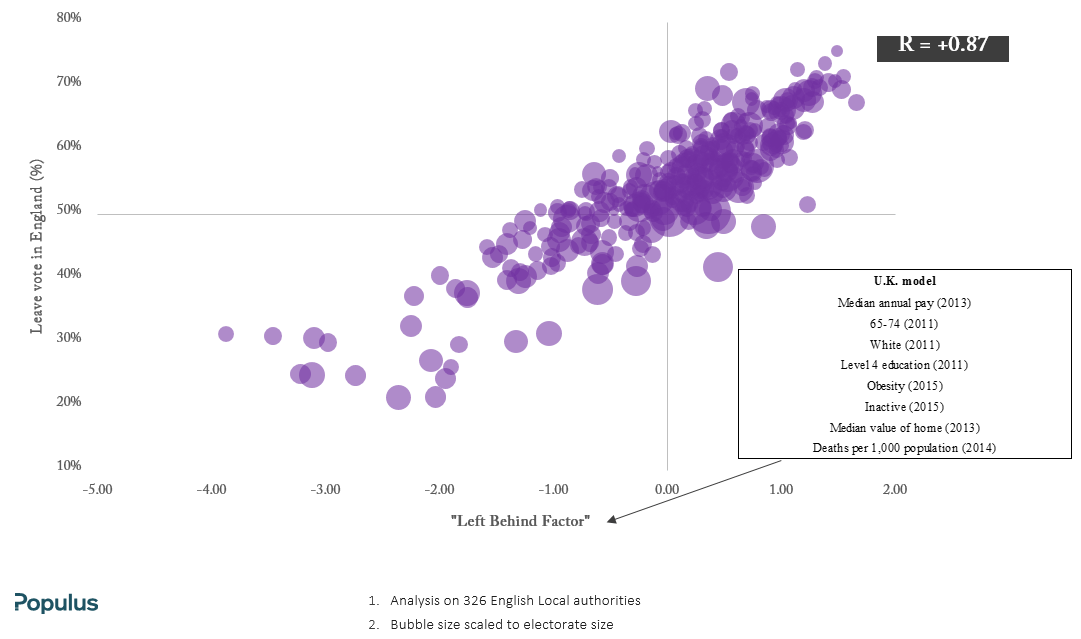
We can then see simply how this one component maps onto the US and English electorates. The results reveal that the change in Republican vote share from 2012 to 2016 and the Leave vote share were indeed driven by similar forces (Figures 2 and 3). In both cases, the swing to the Republicans and the vote for Leave are strongly associated with this “left behind” factor.
Figure 2. USA ‘Left behind’ component vs. swing to Republicans 2012-2016
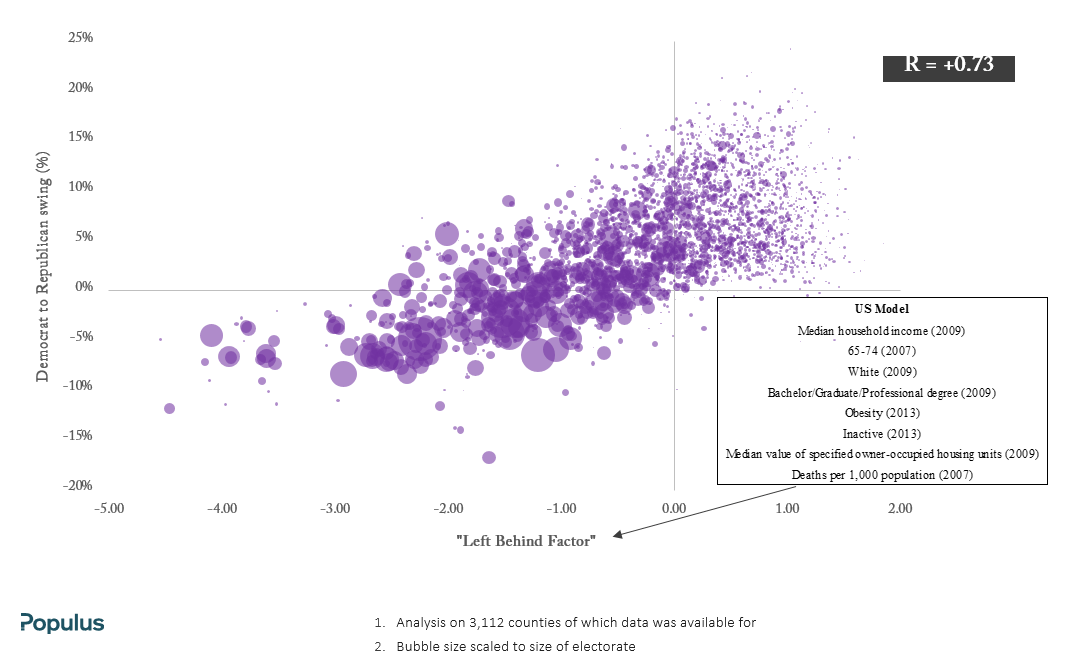
Figure 3. England ‘Left behind’ component vs Vote Leave 2016
Furthermore, this political revolution didn’t come out of nowhere. Several political elections have been a portent to the events of 2016. In the US context, looking back to the last Republican president, George W. Bush, we see that the 1996-2000 swing was very similar to the 2012-2016 swing (Figure 5).
While Trump lost support slightly where George W. Bush put on a few extra percent, Trump managed to attract votes heavily in areas where Bush also did very well.
It is worth noting that the last two Republican presidents have been swept into office on the back of white working class and low education voters flocking to them in greater numbers than previous Republican presidential candidates.
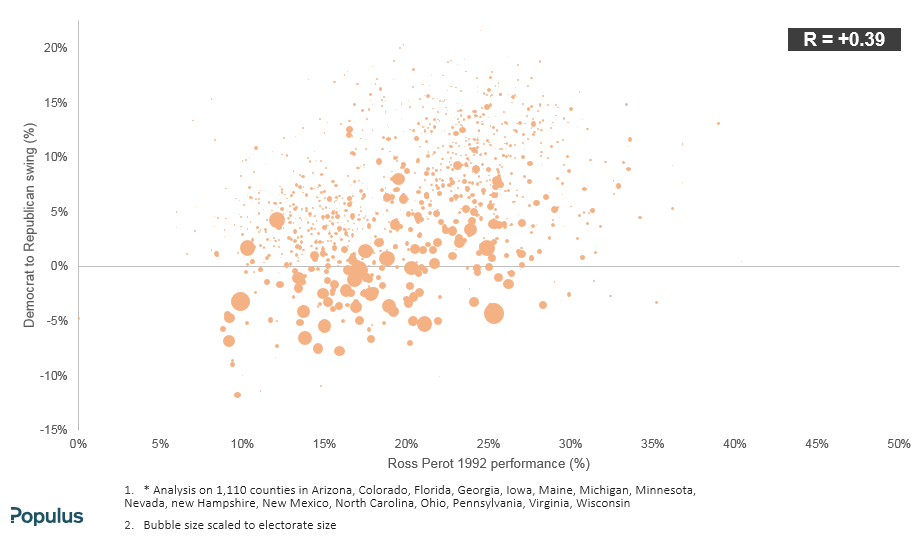
It’s also worth highlighting that in 1992, Ross Perot– another populist billionaire “Independent candidate” who warned of the perils of free trade and eventually won close to 20 per cent of the vote – was something of a harbinger for Trump. The 2012-2016 swing to Trump has a fairly strong relationship to Ross Perot by county in marginal* states (Figures 4 and 5).
Figure 4. Trump’s strategy a pale imitation of George Bush’s 2000 performance
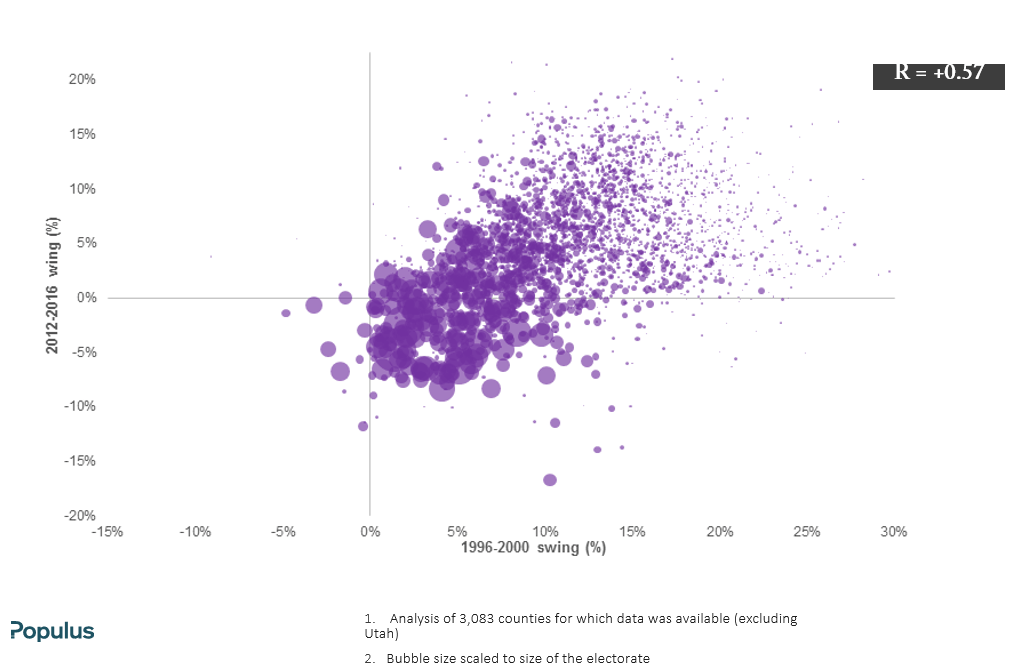
Figure 5. 2012-2016 Democrat to Republican swing vs 1992 Ross Perot performance
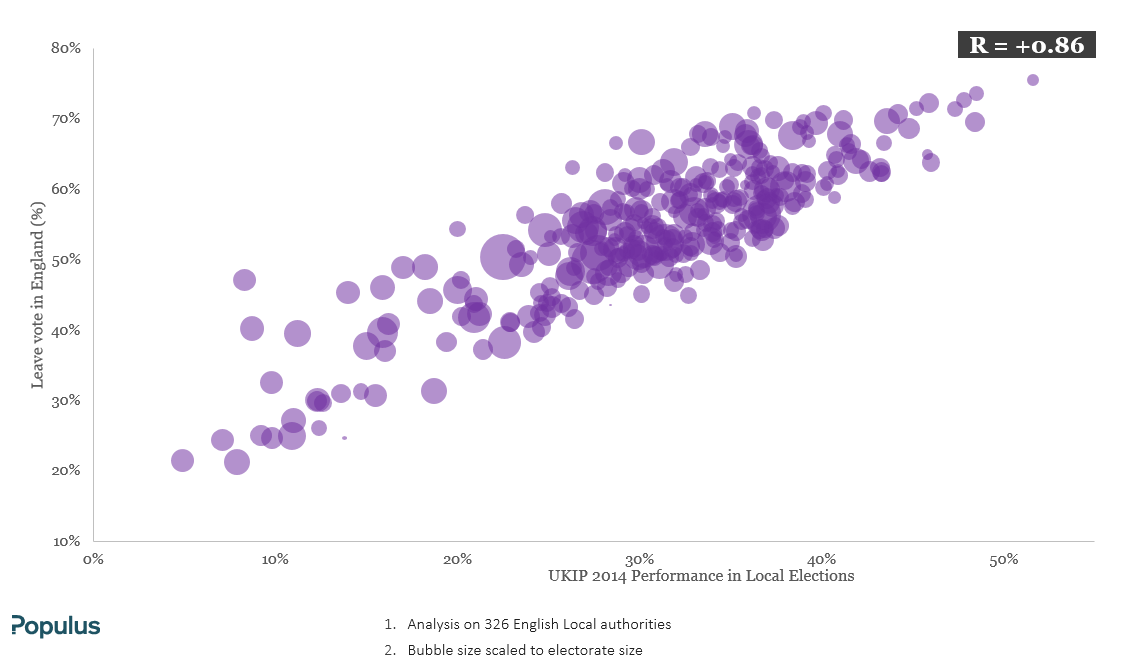
Equally, in the UK, the Leave vote is highly correlated to Ukip’s vote share in the 2014 local authority elections (Figure 6) and the 2015 general election.
Figure 6. UKIP 2014 performance vs 2016 Leave vote
Left-wing politicians such as Bernie Sanders and Jeremy Corbyn have responded to Trump’s victory as a vindication of their focus on inequality. Some analysts, such as Zsolt Darvas and Konstantinos Efstathiou from Bruegel, back this claim that income inequality boosted the Trump vote. However, their analysis is done at the state level using the Gini coefficient, a statistical index to measure income inequality.
When analysed at the more in-depth county level, as in Figure 7 below, it is evident that the most unequal parts of the US swung away from the Republicans to the Democrats. Income inequality, which we have calculated as a log of the top bottom ratio (the average 1 per cent income by the average 99 per cent income), is negatively correlated to Trump’s support.
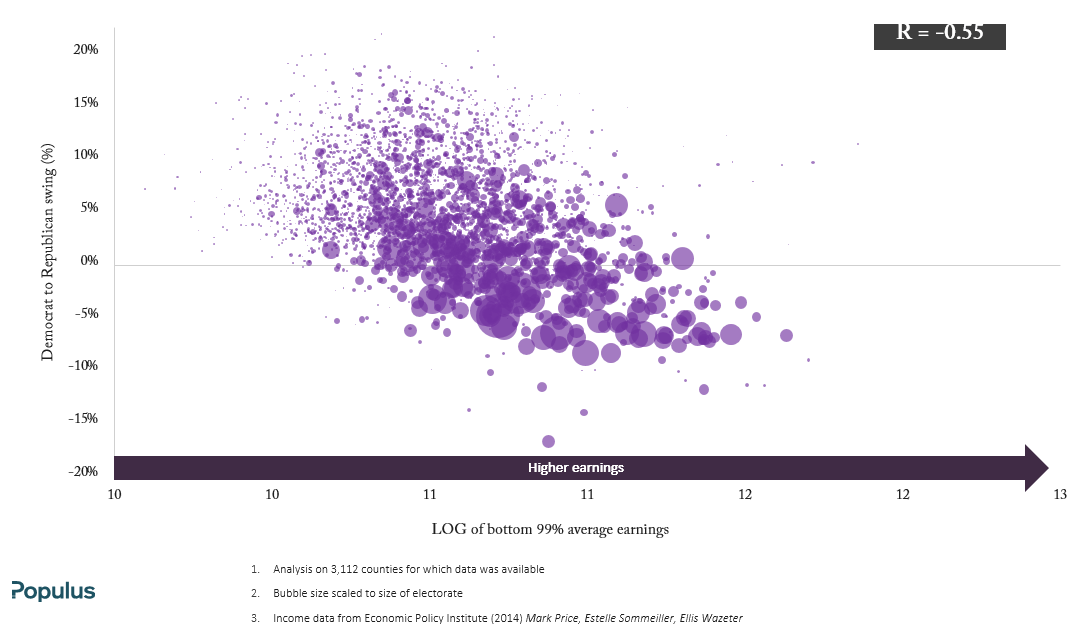
But that does not mean that income does not matter at all; absolute pay is positively correlated with a swing to Trump. The lowest incomes among the bottom 99 per cent are a strong predictor of this swing (Figure 8). Abstract arguments about inequality did not resonate with large parts of the lowest paid in society.
There is good reason to think that Trump’s voters were more concerned about addressing their own income and job insecurity rather than measures which hit the rich to lessen the gap between the top and bottom earning groups. Those with higher incomes swung to the Democrats.
Our findings are supported by Pew Research Centre’s large-scale poll in August 2016, which highlights that almost half (48 per cent) of Trump supporters saw the availability of good-paying jobs as a very big problem in their country, compared to one third (33 per cent) of Clinton supporters. Moreover, only 31 per cent of Trump supporters worried about the gap between rich and poor, whereas this was a concern for 70 per cent of Clinton voters.
Michèle Lamont’s research in The Dignity of Working Men further supports this finding, by picking up on the working class’s views on professionals and the wealthy. She found that while they are resentful of the former, they often admire the rich for working hard and earning their money.
Figure 7. Inequality is not the cause of Trump’s rise
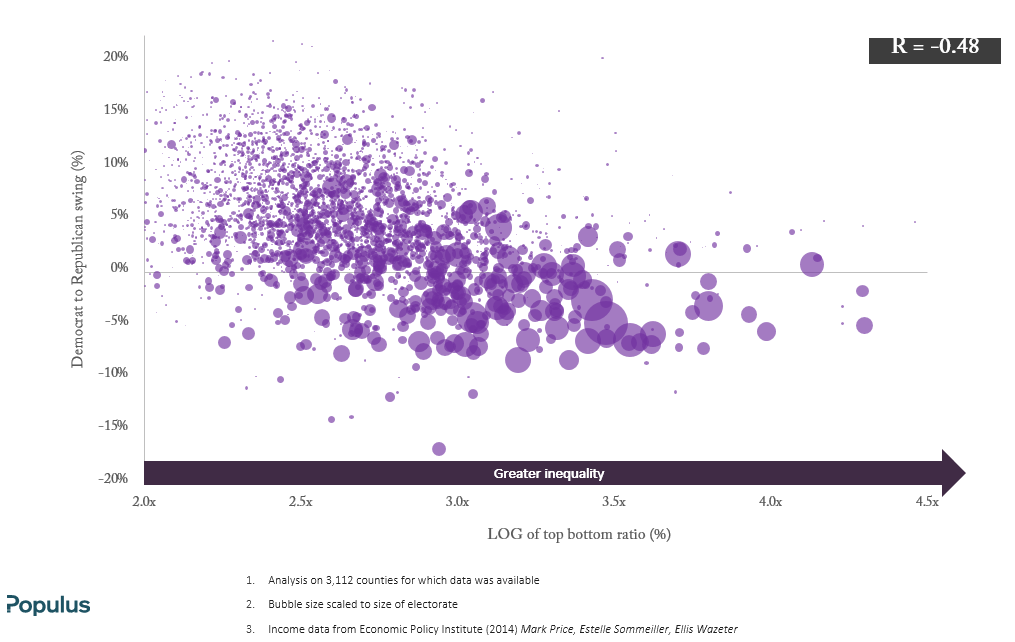
Figure 8. Absolute pay is a strong predictor of a swing to Trump
What we have been discussing thus far has been the sociodemographic attributes of the swing to the Republicans in 2016. While these voters have been largely in “left behind” areas, this does not mean that these are the only group of people who voted Republican.
The rich have traditionally been Republican voters. Indeed, in 2016, many higher income voters continued to vote Republican, but what changed was that lower earning white voters, joined their richer, white, counterparts in voting for the GOP. This had the effect of decoupling a long established relationship between wealth and voting Republican, and increasing the association between ethnicity and voting intention.
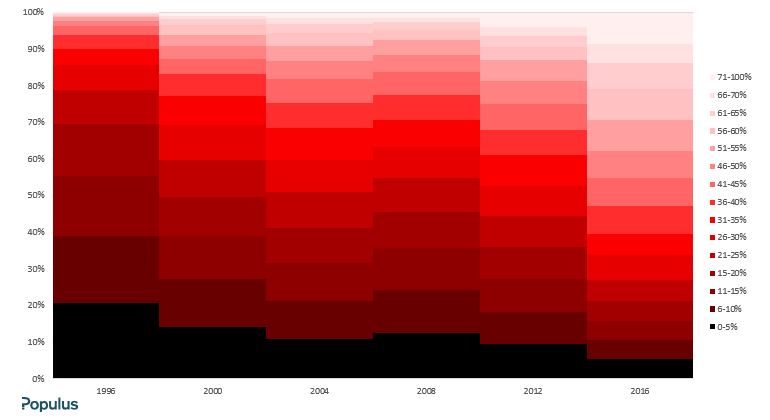
Another key trend behind populist insurgencies has been the role that geography has played. Increasingly, voters of different political persuasions have come less and less into contact with each other. This has profound consequences for the way our political processes and institutions work. In 1996, in close to 40 per cent of US counties, the difference between the Republican and Democrat vote shares was 10 per cent or less.
In 20 per cent of counties, the difference was 5 per cent or less. Twenty years later, only around 5 per cent of counties remain super competitive between the two main parties with a vote share difference of 0-5 per cent(Figure 9).
Figure 9. Increasing political polarisation in US counties, 1996-2016
This geographical polarisation between two groups of similar-minded people, with younger, better educated and better off individuals moving to – and staying in – cities has given rise to non-urban areas having far greater concentrations of older, whiter, less educated citizens than they did in the past.
In the US, this is evident simply by looking at the size of the dots on the graphs, as counties vary by population size. The smaller the dot, the smaller the population within a county. The majority of these small dots registered positive swings to Trump – he won 62 per cent of votes in rural areas according to Pew Research.
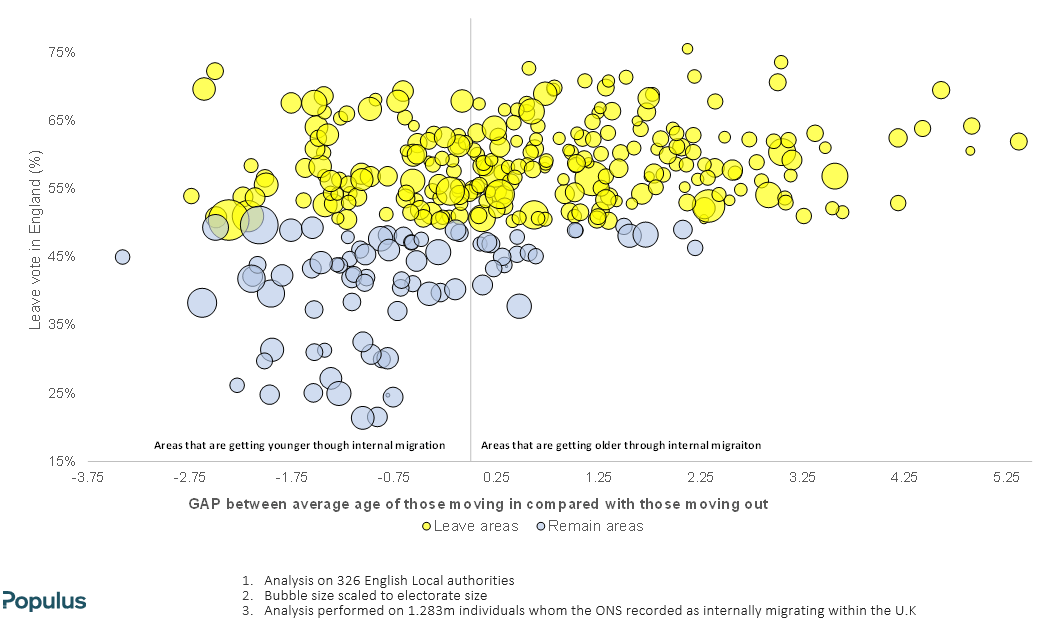
In England, it is highly telling that the Remain vote was concentrated in areas that have been getting progressively younger, whereas the Leave vote was highest in areas that have been getting older as more mobile people (generally younger) have left them (Figure 10).
Figure 10. Population drifts support the ‘left behind’ thesis: Average age of person internally migrating to a local authority in 2015 vs EU referendum vote 2016
The young and university educated have drifted into urban areas with a propensity to stay there. The difference between these two worlds has been exacerbated by the better infrastructure as well as the more satisfying social and career networks that are clustered around cities.
What these people leave behind are hollowed-out, and often white working-class communities that have little to offer those who are forced by lack of opportunity to remain close to where they were born.
The way that the political and media classes have long viewed economic and social issues, such as poverty and social mobility, tends to be through the lens of the city. Reviews into poverty and social exclusion have, for too long, been couched in the language and imagery of the impoverished inner city child juxtaposed against high rise architecture.
But the gap between east London and Canary Wharf in London, for example, is not the one that matters most. In our major cities, there is a proximity to wealth, information, and educational institutions. Good transport links, schools and new development projects abound. It is the boy or girl born in Clacton, rather than Lambeth, who will struggle to get ahead in life.
Cities across the developed world, may view themselves as open, cosmopolitan hubs. In reality, they are closed islands – with wealth and social capital flowing out only through seemingly arbitrary transport spokes. It’s the reason why areas such as the Isle of Sheppey in Kent, only 50 miles outside of London, but three hours and four changes by train has higher poverty rates and educational attainment figures than tracts of inner city London.
On the other hand, Cambridge, 65 miles from London, but a convenient 45 minute train journey away, is an increasingly typical story of a university town with good, and improving, employment prospects and growth, in part driven by its symbiotic relationship with the capital.
Geography – and the city/rural divide – also helps to explain why it is the white portion of the working class that swung towards Trump and voted to leave the EU in much greater numbers than ethnic minority groups.
The vast majority of ethnic minorities live in cities (Figure 11), with a greater proximity to good educational institutions, job prospects, well-connected transportation and career networks.
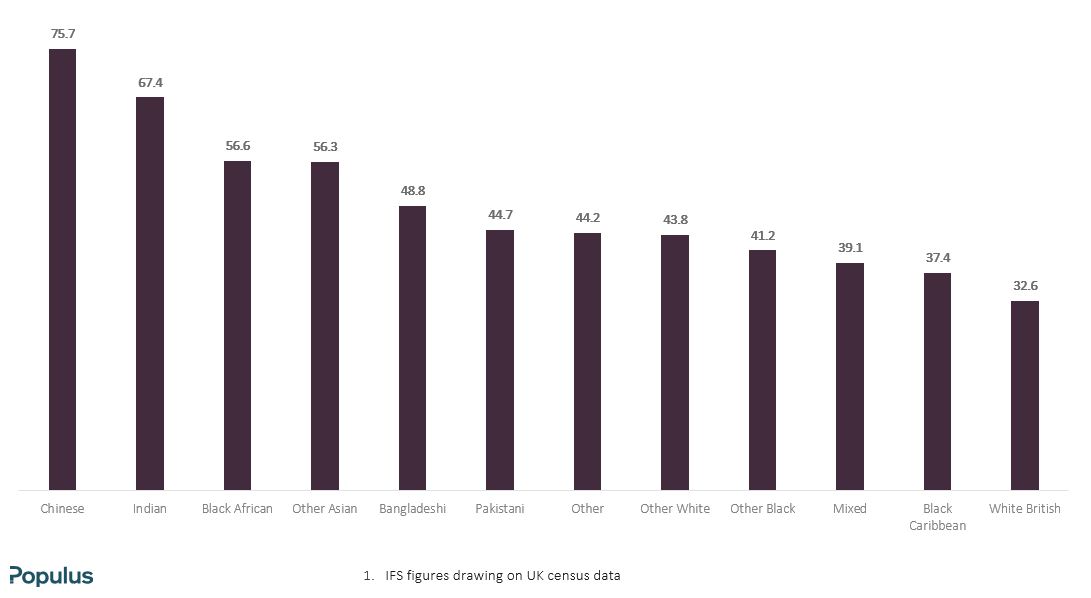
A recent publication by the independent and non-partisan Institute for Fiscal Studies (IFS) demonstrates that ethnic minority groups are now, on average, significantly more likely to go to university than their white British peers. Looking at the proportion of young people in the lowest socioeconomic quintile group in particular, white British are behind all other ethnic groups when it comes to the per cent going to university (Figure 12).
Figure 11. Ethnic minorities are much more likely to live in dense, urban areas than rural parts of England and Wales
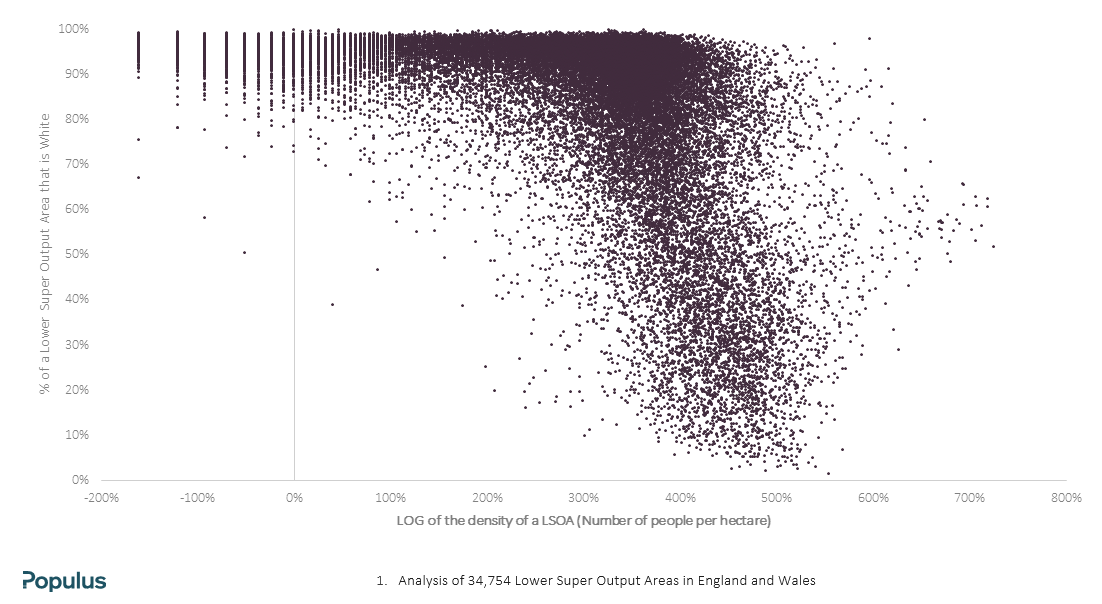
Figure 12. Per cent of pupils in the lowest socioeconomic quintile going to university
Finally, in addition to the economic and cultural drivers of the Brexit and Trump votes, there was also a political element of voters rejecting “the establishment”. While levels of trust in political institutions, politicians, experts and authority, are not very high overall, they are particularly low among Leave and Trump voters.
A YouGov survey in the lead up to the UK referendum on EU membership found that Remain voters were much more likely than Leave voters to trust economists, politicians, academics, and think tanks. Trust levels were also higher among middle class than working class voters.
The same trend was evident in the US, where trust in government is much lower among Republicans than Democrats, and is also lower among less educated than higher educated voters.
“Taking back control” and “Making America Great Again” are powerful slogans which tap deeply into an impulse amongst millions of voters to restore wealth and former prosperity. While they point linguistically to the past, most Americans and Brits were voting with the future in mind.
When casting their ballots, they were answering questions such as, will my area be better in 10 years’ time? Will it be better for my children? Many thought the answer was emphatically no.
The status quo, and the continuity it promised, was simply not a good enough offer for millions of voters. However, whatever campaign promises were made, coal mines and old manufacturing centres can’t be revived.
But the fact remains that the way to get ahead in life can’t be limited to a one-way ticket to a capital city. In addition to the economic and cultural drivers, the political reasons for populist support also need to be addressed. Finding more constructive ways of making people feel like their voice matters will be key to rebuilding trust in political and democratic institutions in the longer term.
A much more compelling, but as yet unspecified, offer of economic and political reformation is needed. That’s the policy problem on the desks of leaders across the developed world today. A better and deeper understanding of why so many people took to anti-establishment offers is a necessary starting point.
In the territorially based systems of Westminster, Congress and the US presidency, such pronounced geographic divides – where some places are “left behind” and others appear to be racing ahead – will continue to shape politics in the years to come.
Whether we are witnessing a temporary or long-term repositioning between urban liberals and those who are passed by depends greatly on whether existing political parties can reassert themselves or give way to new political coalitions.

Josiah Quincy Jr., who was the mayor of Boston in the middle of the nineteenth century, wrote in his Last Will and Testament that his son should read ‘John Locke’s works, – Lord Bacon’s works, – Gordon’s Tacitus, – and Cato’s Letters. May the spirit of liberty rest upon him!’ Indeed, there is nothing closer […]
Spare a thought for Jared Kushner and Steve Witkoff, heading the US negotiating team, as they met with Qatari Emir Al Thani this week to discuss the ‘progress of the negotiations’ between the US and the Iranian regime in the Qatari capital, Doha. While the venue for the talks has shifted from Pakistan to Switzerland […]

The World Cup starts today and for the first time in over 30 years it is being held in North America. Not only is this exciting news for football fans, it should also be of interest to free trade enthusiasts, as the last time it was held there the North American Free Trade Agreement (NAFTA) […]