During an election campaign opinion polls are monitored with great intensity, and not just by nervous partisans. In a high-stakes election, everyone wants to know who’s winning.
But that’s easier said than done when there’s so much disagreement between polls. All of them show the Conservatives ahead – and probably by enough to win an overall majority – but with everything from a six-point Tory lead over Labour to a 14-point lead in just the last week, the casual observer could be forgiven for wondering what on earth is going on.
Polls do of course have margins of error, but these apply to random statistical noise between individual polls, not to systematic and consistent divergence between results from different pollsters over time.
How so these consistent differences arise? Contrary to the widely-peddled myth, it has nothing to do with the editorial leanings of the newspaper publishing it.
It’s easiest to start by explaining what polls do. Polls estimate public opinion across a population by taking a sample of the population. The statistical basis for this is that the sample is either selected randomly – and therefore by definition representative of the population – or if not random, that can be made representative of the population.
Conventional polling uses the second of these approaches, so to make polls representative, a number of methodological decisions need to be made. There is often no single right approach, and the choices pollsters make will often have consequences for the results.
For example: how do you recruit your respondents? What mode of interview (phone, online, face-to-face) do you use? What quotas, if any, do you set for the sample? What weighting variables do you use to correct imbalances in the raw data? How do you take account of different likelihoods of voting of different electors? What about people who don’t know or refuse to say how they intend to vote?
Since there are many ways in which methodologies can differ, and many of them interact with one another, it can be difficult to unpick exactly why two or more pollsters consistently arrive at different estimates of public opinion. But sometimes the source of the variation can be inferred.
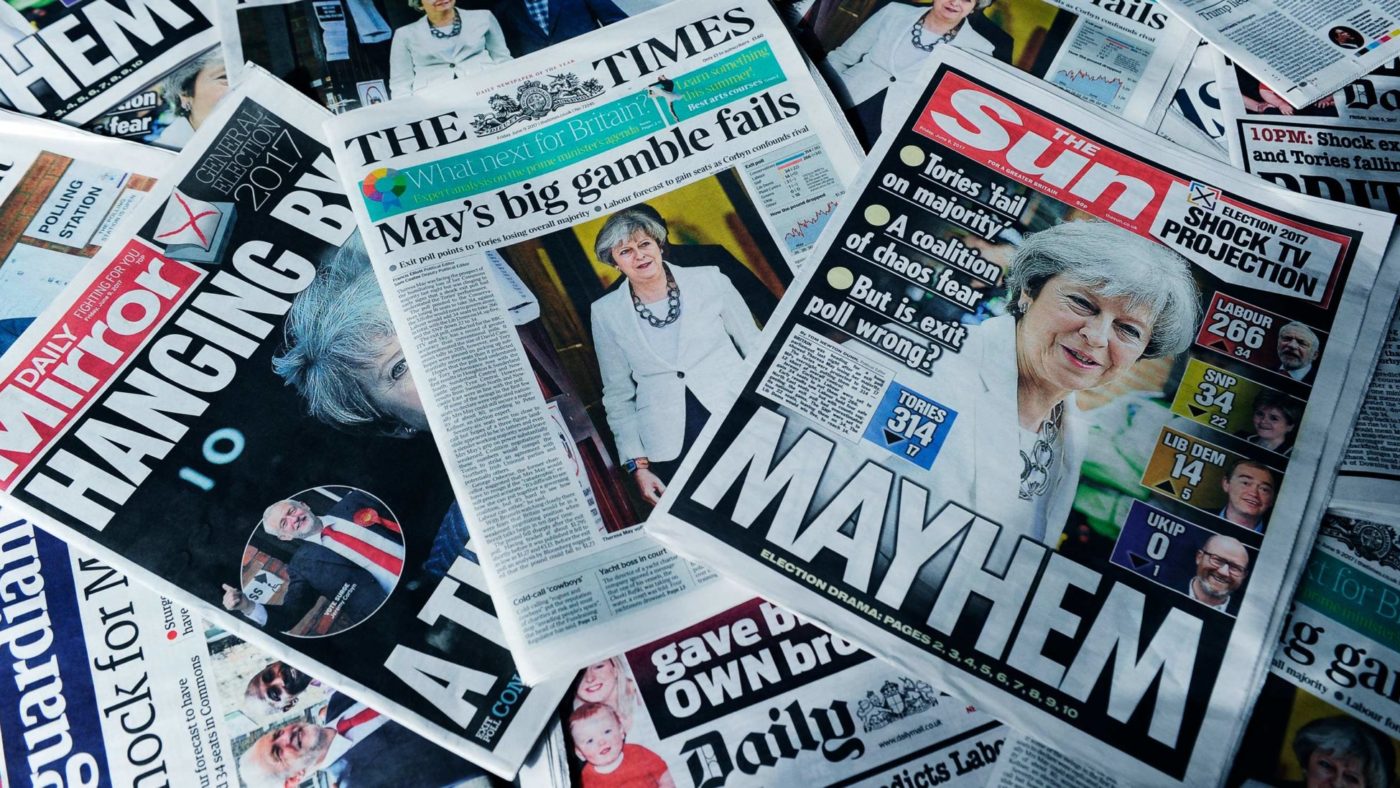
In 2017, for example, final polls varied wildly on the size of the Conservative lead. In this case, the primary reason was clear. Those showing narrow Tory leads over Labour were basing their turnout assumptions on how likely people said they were to vote. Those showing wider leads were using complex turnout modelling instead. Some of these models went very over-the-top, leaving too few Labour voters among those expected to vote.
In 2019, there again seems to be a clear explanation for at least part of the discrepancy. Among the possible weighing variables mentioned above, many UK pollsters weight their samples to ensure that the way their respondents voted in the last election matches the result. In theory, this makes complete sense – a representative sample should match the result.
In practice, it’s not so simple. Though it may sound strange to political anoraks, a lot of people are very, very bad at remembering which way they voted, even in the recent past. A number of pollsters have conducted experiments where they interviewed people who had said just after the 2017 election that they had voted Labour, and asked them once again how they had voted in 2017. In one case, about one in five, or about 8 per cent of all 2017 voters, thought that they had voted for a party other than Labour.
So it follows if we have the right proportion of actual 2017 Labour voters (41% of the Great Britain vote) we would have a much lower proportion of those remembering having voted Labour last time. If we were to weight people’s recalled 2017 vote to the result, we would then end up with too many 2017 Labour voters.
There are a few ways to deal with this. Some online pollsters, including YouGov and Opinium, past vote weight using 2017 votes collected at the time, thus taking memory out of the equation. Others, such as Kantar and Deltapoll, weight using recalled past vote, but to a target adjusted for false recall. And still others, namely Number Cruncher and Ipsos MORI, don’t rely on past vote weighting at all.
The average Conservative lead among this set of pollsters in polls so far during the campaign has been 13 points. Among the rest, it’s been 8 points. Does this mean that the set showing the wider leads are right and the others are wrong? I would exercise a degree of caution here.
The methodologies that lead to bigger Tory leads have ways of dealing with or avoiding a known difficulty for pollsters while the others do not. But in any election, particularly one as complicated as this, there are a number of other potential sources of error that could affect polling accuracy in either direction. And as always, polls are a measurement of the present, not a prediction of the future.
So while the true gap between current Labour and Conservative vote shares may be a bit likelier to sit near the wider end of range of polls, the fog of uncertainty remains.
Click here to subscribe to our daily briefing – the best pieces from CapX and across the web.
CapX depends on the generosity of its readers. If you value what we do, please consider making a donation.
