Immigration statistics published by the ONS in May show that, when it comes to housing, we’re stuck running up the down escalator – one that is getting faster and faster.
Net migration soared to a record 606,000 in 2022. That equates to population growth of 0.9% or adding two cities the size of Newcastle to the UK in just a single year. There’s a good chance this estimate will be revised upwards in due course too, much as the estimate for 2021 was increased by 23% in the May data release.
In any case, this already unprecedented number has provoked recriminations across government (so much for the promise that ‘overall numbers will come down’) and prompted a flurry of commentary on its wider implications. Housing has become central to this debate, for almost nobody now denies that we are in the grip of a dire housing crisis, and only the truly blinkered can maintain that increasing demand at a much faster rate than supply is irrelevant to the situation.
At the Centre for Policy Studies, we have been banging the drum on this for a while. In particular, in summer 2021 we used the Government’s own methodology to draw attention to the widening gulf between the existing housebuilding target and the target we actually needed to set. In light of last month’s immigration revelations, I have updated this analysis and extended it backwards to 2013. The picture that emerges is pretty grim.
Notionally, the Government still has a housebuilding target of almost 300,000 homes a year in England (not the UK as a whole). This target is based on a set of assumptions about underlying population growth, household formation and housing market trends, as well as net migration (to England) of 170,500 per annum. Those endogenous factors account for the bulk of the housebuilding target, with net migration adding demand for another 72,250 homes.
Now, the methodology used by the Government is open to criticism, not least because the target was adopted in 2020 on the basis of 2016 analysis of 2012-14 data. The ONS has revised its household formation figures since then. It has also cautioned that household formation estimates should not be used to make definitive claims about housing need – a point echoed by the CPS, not least due to the way the housing crisis appears to have suppressed household formation on a very significant scale. The Government’s approach to formulating a housebuilding target also does not adequately take into account the distribution of housing demand, which is intensely concentrated in London and the south-east.
Nevertheless, it is obviously the case that, given the methodology adopted by the Government in setting its housing targets, higher net migration should mean a higher level of housing need.
Crunching the numbers using this approach suggests that we should have built around 461,000 homes in England in 2022 – 55% higher than the official target. Net migration (adjusted by a factor of 0.9 to reflect the number of migrants coming to England specifically) beyond that anticipated in the housing target pushed the total up by 163,000 homes. And overall, net migration accounted for 58% of total housebuilding need, pushing the need for new homes up by 235,000 compared to a ‘net zero migration’ scenario.
In fact, we built just 177,810 new homes in England in 2022 – just two fifths of what we needed to match estimated growth in housing need. Of course, some people have argued that looking at dwelling completions is misleading, and that the best metric is the overall size of the housing stock. But even using this metric, which includes homes created through change of use, only gets us to net additional dwellings of around 235,000 for 2022 – barely half of the 461,000 we needed. In other words, whichever way you look at it, we are running a colossal ‘housing deficit’.
When we take into account the geographical distribution of demand for homes, this deficit looks even more stark. Migrants who come to England disproportionately live in London and the south-east, where economic opportunity and universities are concentrated. Yet net additions to the housing stock in those areas amounted to just 78,220 homes in the 2021-22 financial year, during which period net migration to England was around 509,000.
Some might argue that a significant proportion of immigrants last year were Ukrainian refugees, who are mostly staying with host families and will eventually return home, adding little in the way of long-run housing demand. However, even if Ukrainians are removed from the figures, we would still need to have built an extra 190,650 extra homes last year.
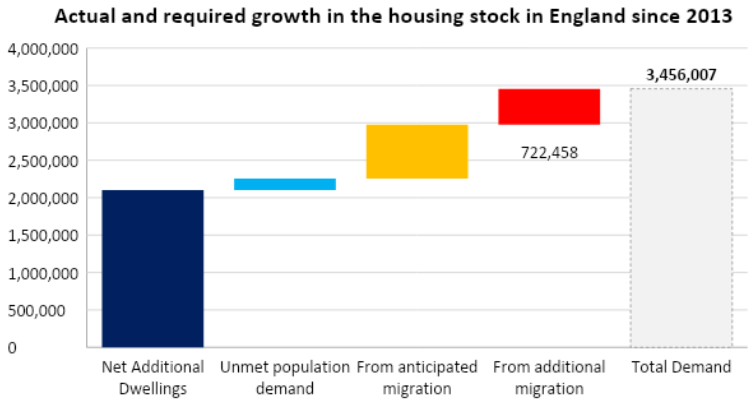
Moreover, we cannot look at 2022 in isolation. Everyone knows we have not been building enough houses for decades now. But even if we look at merely the last 10 years, the scale of the problem is daunting. Since 2013 we should have built around 3.46 million homes: 2.25 million to meet underlying demand pressures, and 1.2 million to cope with net migration (0.48 million as anticipated in the housing target, and then another 0.72 million).
In fact, we have built 1.52 million homes in that period. That leaves a shortfall of 1.94 million homes, with net migration in effect accounting for 79% of the deficit. Again, we can look at this in terms of net additional dwellings, and the picture is likewise not much better. Since 2013, the housing stock in England has grown by around 2.10 million homes. So the growth in the housing deficit since 2013 still amounts to around 1.35 million homes, with net migration accounting for 89% of the deficit. And of course, that deficit is intensely concentrated in London and the south-east.
In other words, under the Government’s own methodology, the raw numbers suggest that the net migration effect accounts for roughly 90% of the intensification of the housing crisis in England over the last decade.
Of course, there are a number of factors driving skyrocketing house prices: our broken planning system and failure to build enough houses first and foremost, but also asset price inflation caused by a prolonged period of ultra-low interest rates, demand-side policy interventions such as Help to Buy, and frictions in the housing market such as stamp duty. But to these we must undoubtedly add the very large number of people who have moved to the UK in the last few decades.
It is also likely that recent high immigration, especially over the last year, is a significant factor in extremely tight rental markets in London and other major cities, given migrant rental patterns, which suggest a net increase of around 358,000 people entering the rental market in England in 2022. According to the ONS, private rental prices have increased by over 16% in real terms since January 2015, with a quarter of this rise coming in 2022 alone, while according to analysis from research firm Capital Economics, net migration increased average UK rents by up to 8% in 2022.
Clearly, as with the broader housing crisis, there are lots of factors other than migration feeding into rising rents, including higher interest rates, buy-to-let tax changes, pending rental reforms and new energy efficiency requirements, all of which are causing landlords to exit the market. But again, we cannot ignore the substantial demand pressures caused by soaring numbers of new arrivals.
So in light of May’s record figures, it is clearer than ever that we need to significantly increase housebuilding while also getting immigration down to manageable levels – otherwise we are doomed to be running up the down escalator as we try in vain to escape the housing crisis.
Click here to subscribe to our daily briefing – the best pieces from CapX and across the web.
CapX depends on the generosity of its readers. If you value what we do, please consider making a donation.
