Austerity has often been accused of making people poorer – but is it shortening their lives as well? That’s the suggestion made by Sir Michael Marmot of University College London today. And the thing is, he may well be right.
Back in 2015, the economist Anne Case and Angus Deaton identified a puzzling and alarming phenomenon. Mortality rates among white, middle-aged Americans were rising – even as they continued to fall in other countries. If death rates among 45- to 54-year-olds had stayed the same as in 1998, they said, 96,000 deaths would have been avoided. If they had carried on falling at previous rates, the total would be half a million – comparable to the toll of the Aids epidemic.
Earlier this year, Case and Deaton came back with a new report. This phenomenon, they argued, was driven by a surge in “deaths of despair” – suicide, drug overdoses, alcohol poisoning – as well as slower progress in fighting cancer and heart disease. Part of this was the horrific opioid epidemic, which has led to a situation (as I pointed out when the most recent stats were published) in which drug overdoses are now more Americans per year than died in the Vietnam War.
Drug overdoses are now killing more Americans per year than died during the whole of the Vietnam War (58k) https://t.co/usXiY3XKJo
— Robert Colvile (@rcolvile) June 5, 2017
Others have disputed the findings, but there’s no doubt that something somewhere has gone badly wrong. As Deaton and Case point out, white Americans with no college degree have gone from having mortality rates 30 per cent lower than African-Americans in 1999 to 30 per cent higher. The effect is so large that life expectancy for Americans as a whole is going down for the first time in 20 years.
The obvious question, then, was: is this just an American problem? Or could you find a similar pattern here in Britain? Has the great engine of increased life expectancy, which has powered us through the 20th century, have blown a cylinder here too?
If you delve into the figures, there are indeed some worrying signs. Female suicide rates are at their highest in a decade. The Office for National Statistics reports that the rate of deaths from drug misuse increased by 8 per cent in 2015, reaching an all-time high. Deaths involving heroin and/or morphine doubled between 2012 and 2015, and are now the highest on record – as are deaths from cocaine misuse. In total, the drug-related mortality rate among adults in the United Kingdom aged 15 to 64 is almost three times greater than the European average.
So is Britain, too, falling victim to those deaths of despair? Not exactly. While we may be closer to America than the rest of Europe, we are – in terms of our drug problems at least – far, far more European.
The chart below shows the trend for drug-related deaths in England and Wales. And taken in isolation, it does look alarming. But the important thing to realise is that those rates are per million people.
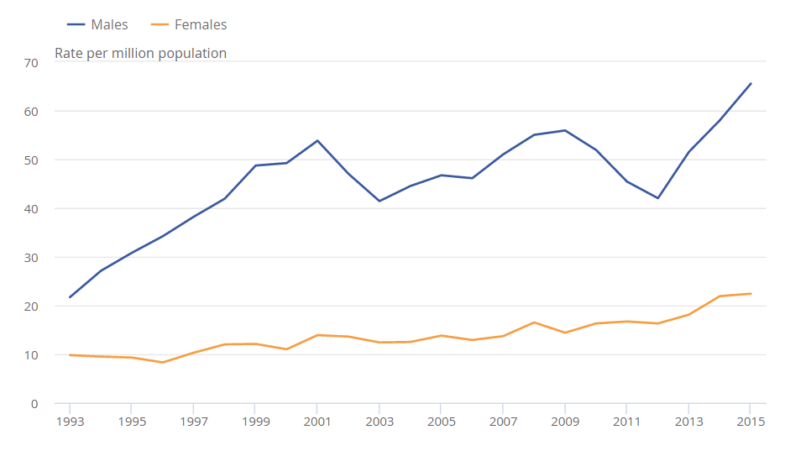
Now compare that with the situation in America. The state with the lowest rate of deaths from drug overdoses is Nebraska, at 6.9 per 100,000 inhabitants – or 69 per million. In other words, the death rate from drug overdoses among British men is lower than the lowest figure in America, and far lower if you only take Nebraska’s men into account rather than the whole population. We certainly have nothing like the problems seen in, say, West Virginia, where the death rate is an extraordinary 415 per million. (To give you an idea of how quickly the totals have risen, the highest back in 1999 was New Mexico with 15.0 – and in some states the rate was zero.)
Obviously, there may be differences in reporting standards. But the highest-risk group in the UK – those aged 30 to 39, among whom the rate is 98 deaths per million – are still right at the bottom of the league table in the US. And that’s reflected in the numbers we’re talking about: UK deaths involving cocaine reached an all-time high, yes, but that was still just 320 people. The total was 3,674 – too high, yes, but not evidence of a similar national crisis.
Indeed, when you look at the other components of Case and Deaton’s despairing portrait, the picture is far more positive. Drug use, in general, has fallen markedly over the past decade. In 2005/6, more than one in 10 British adults confessed to having taken illegal drugs in the past year. That is now down to one in 12. The level of alcohol-related deaths is still higher than in the early 1990s, but the figures have remained broadly unchanged over roughly a decade.
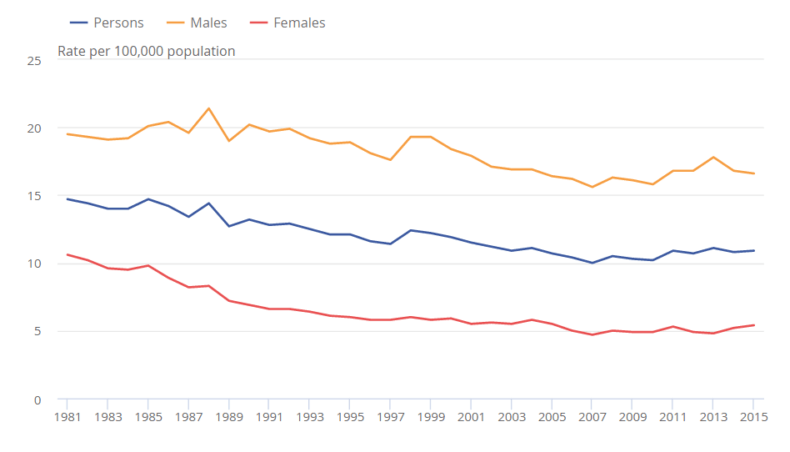
It’s the same when it comes to suicide. Yes, deaths have been rising slightly, in particular among males under the age of 30. But overall, the situation is far from bleak: as the ONS statistics show, overall rates across the UK have been trending broadly downwards ever since the 1980s.
None of this is to say that Britain does not have pockets of misery and deprivation. There are inevitably parts of the country, or individual professions, where the risks of suicide, drug addiction and alcohol abuse are far higher. The risk of suicide among low-skilled construction workers, for example, is almost three times the national average – and female nurses and male and female carers are also at greater risk.
But try as you might to spot it in the statistics, it is impossible to argue that Britain has an equivalent problem with “deaths of despair”. We have a nasty problem with drug overdoses, yes – but it’s hard to see anything approaching the scale or severity of what’s happening in the States. Certainly not enough to affect the mortality figures, which show absolutely no such bump among the middle-aged and undereducated.
Yet this isn’t the same thing as saying that Britain doesn’t have a mortality problem. It just has a very different one. And whereas America’s is linked to one particular demographic cohort, ours is far more widespread.
Put at its simplest, Britons have started dying earlier than they should. This is the pattern identified by Sir Michael – but it is also, as I discovered while researching “deaths of despair”, the hottest of topics among Britain’s actuaries.
At a meeting of the Staple Inn Actuarial Society back in April, the experts confirmed that “national mortality improvements have fallen off a cliff since 2001”. We’ve gone from a decade in which mortality rates fell by 3 per cent a year to falls of less than 1 per cent – and it’s happening in winter and summer, among young and old alike.
And while the statistics being discussed were from 2015 (as were those used by Sir Michael this week), the trend is showing no signs of showing down. As Stuart McDonald, head of longevity at Lloyds Banking Group, pointed out in that April meeting, weekly deaths in 2017 are running at 15 per cent above the usual average (which is all the more alarming when you consider that winter, the usual big killer, was relatively dry and mild).
So what’s going on?
The slides below (which I’ve taken from the various presentations at that SIAS meeting) show the scale of the problem.
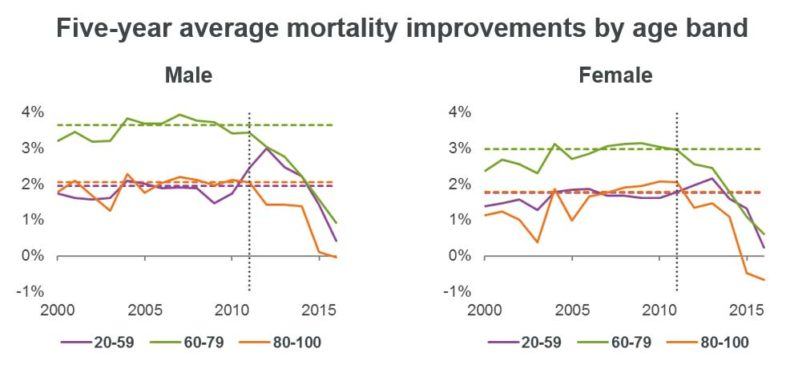
Improvement rates in mortality are falling among all age groups, with the sharpest fall among the elderly – here is the chart for those aged 70-90: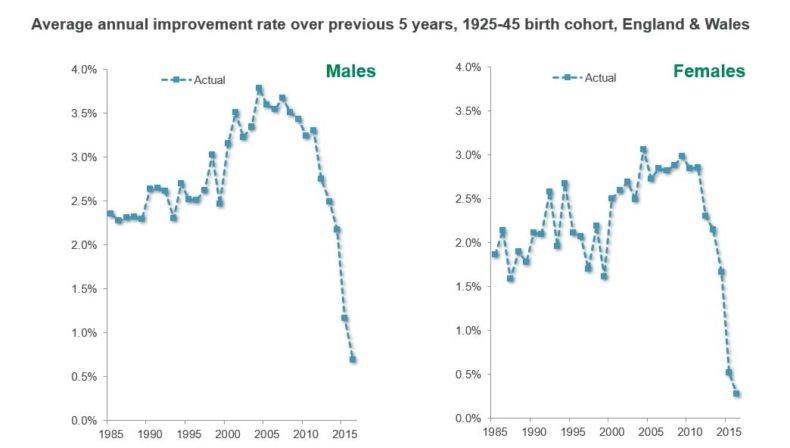
And here, for many, is the slide which explains it all – although, to be fair to its creator, it was originally headlined “Correlation is not causation”.
The argument here is simple. The reason that Britain has escaped the United States’ fate is not just that it’s harder to get the drugs. It’s that we have a safety net to catch people where they fall, in the form of the NHS and the social care system. And austerity has seen that safety net start to fray.
This was the possibility raised this week by Sir Michael Marmot. But it’s also a view taken seriously by many other experts, precious few of whom are bright-eyed Corbynistas.
“The recent sudden slowdown at the oldest ages was not expected,” says Peter Banthorpe, global head of research and development at the reinsurance giant RGA. “We believe this is most likely caused by the impact of austerity measures on health and social care.
“This explanation fits well with the differentials seen between socioeconomic groups where the more vulnerable in society are seeing the more significant slowdowns in mortality improvements.”
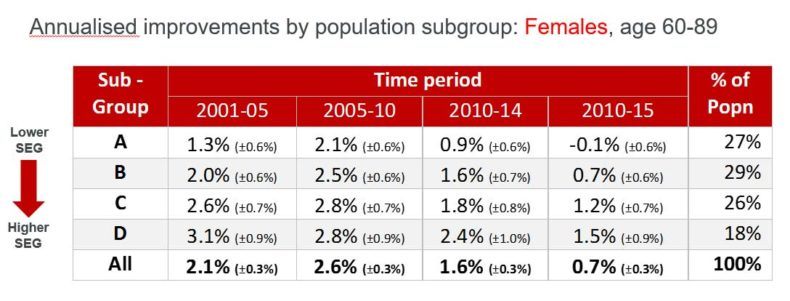
In that meeting in April, Banthorpe’s colleague Stephen Courquin broke down the mortality results by socioeconomic group: in this scheme, A is the poorest group and D is the richest. 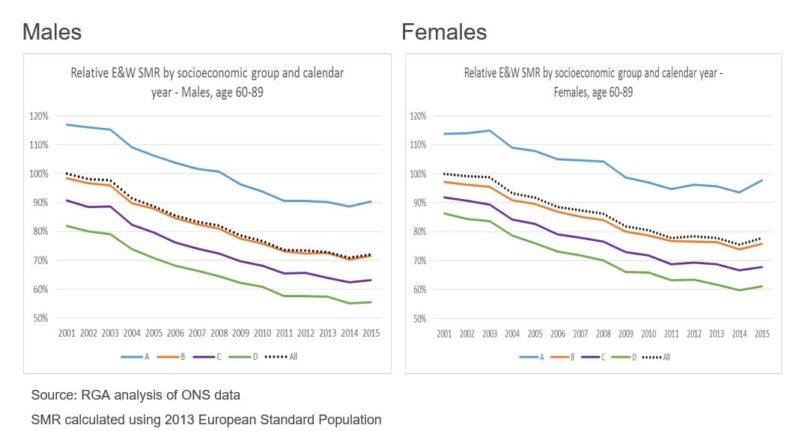
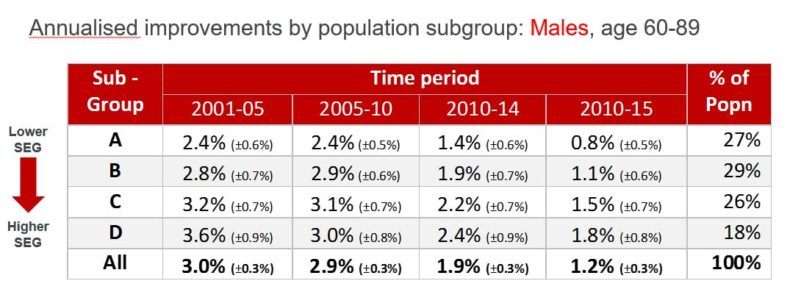
The marked uptick recently among the elderly came predominantly, as Banthorpe says, among the poorest in society. Here, in greater detail, are Courquin’s findings. They show that back in 2005-10, mortality was increasing at much the same rate for most of us. In the years since, the gap between rich and poor has widened, especially among women, to the point where mortality rates among the poorest are actually going backwards.
So is it time to march on Downing Street with pitchforks?
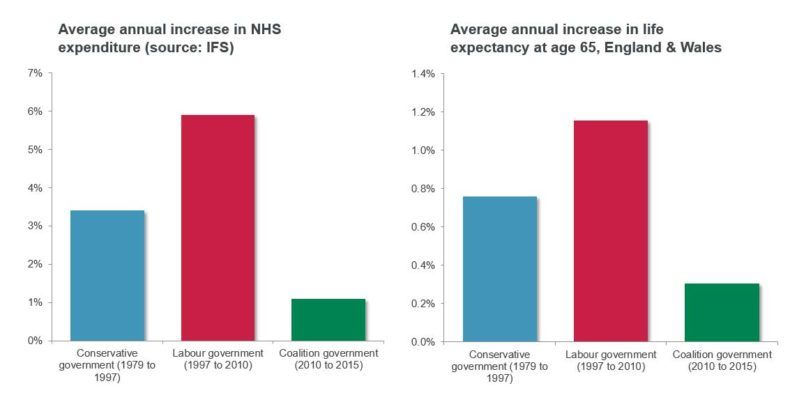
The statistics here are not something that can be brushed aside. There may be serious question marks over how much money we can and should give to the NHS and social care, and how well that money is spent. But it’s clear that there is a broad correlation between input and output: cash is the fuel that powers the engine.
Yet at the same time, this story isn’t just about austerity – or perhaps even mostly about it.
For one thing, spending on the NHS has actually increased in real terms. It just hasn’t matched the runaway (and unsustainable) increases seen under Labour.
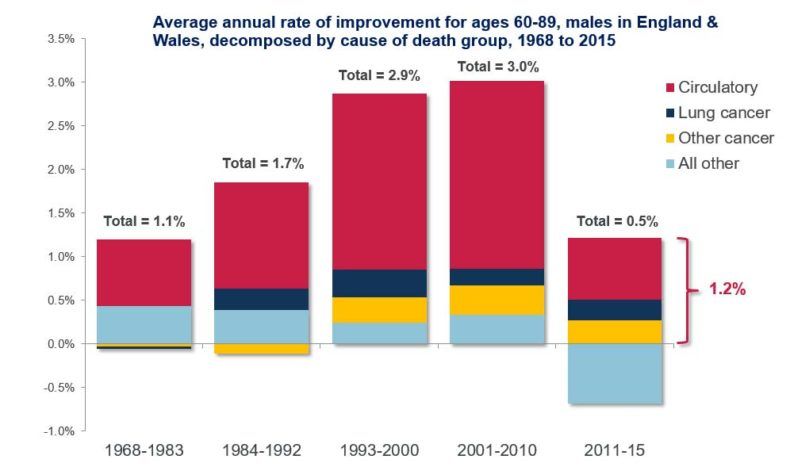
For another, the great improvements in life expectancy in recent decades have been driven, as this chart shows, by our lungs and our hearts. We stopped smoking and started eating more healthily (or at least taking statins along with the burgers) – and found ourselves living far longer.
“The increases that we were seeing couldn’t be sustained indefinitely,” argued longevity expert Richard Willets at that meeting. He points out that the number of old people getting heart attacks and strokes has gone from 4 per cent per year in 1968 to 1 per cent today – resulting in an enormous longevity bonanza. It may be that what we are seeing, as well as the impact of austerity, is a reversion to the mean after a period of unusual and unsustainable improvement, driven by plucking the low-handing medical fruit.
We are also seeing growth in other killers. The reason that the blue “other” line is pointing in the wrong direction in that final column is partly because of the growth of other illnesses, including dementia and diabetes.
There is also, experts say, a more general phenomenon in which mortality tends to improve for everyone in good times, but then diverge in the bad – because the rich have more resources with which to protect themselves, for example by keeping their homes toasty warm in winter. The culprit in that case may not be so much austerity itself as the economic conditions which necessitated it.
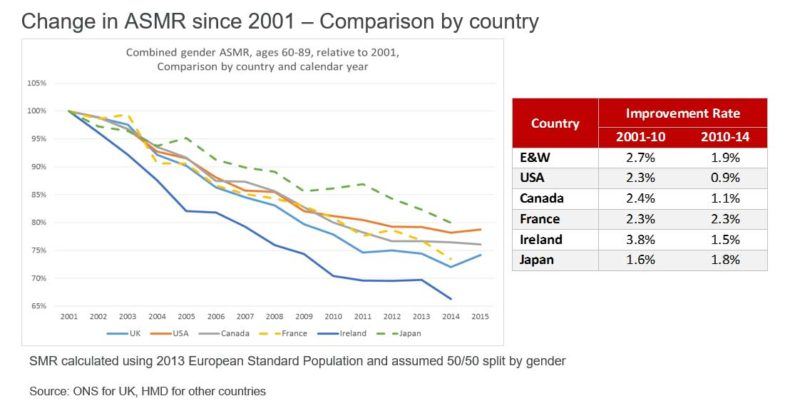
It is also worth pointing out that the UK is not alone in seeing mortality rates plateau. Courquin produced this chart comparing the situation for the elderly in England and Wales (the light blue line) with various other countries. The uptick between 2014 and 2015 is alarming – but while some countries (Japan, France, Ireland) have seen rates fall while ours have flatlined, America and Canada – with their very different fiscal policies and health systems – have both had similarly unimpressive performances. It’s also worth pointing out that Britain has seen mortally rates fall more sharply than most other countries before that – suggesting that it might be harder to make further progress than for others.
Perhaps the biggest lesson from studying the mortality tables, however, has nothing to do with the recent spike at all.
If you look back at the chart of mortality rates by socioeconomic group, what is most striking is not, in fact, the recent uptick at the end. It is the fundamental divergence between rich and poor. Yes, the rich are improving their odds of dying more quickly than the poor. But they are also doing so from a far higher base.
The in-depth statistics, again compiled by the ONS, are nakedly shocking. Compared to those born in London’s poorest boroughs, those born in its richest have a “healthy life expectancy” – the duration not of their lives, but of living what is generally considered to be a good life – that is 13.6 years higher for men and 17.6 higher for women.
At the top and bottom ends of the scale, a boy born in Wokingham can expect to live a healthy life till the age of 70.5 (which will doubtless increase over the course of his life). For his cousin from Blackpool, the figure is just 55. A girl born in Richmond-upon-Thames gets an extra 17.8 healthy years over her long-lost twin from Manchester. It is probably not a coincidence that Blackpool has the shortest life expectancy and the highest rates of smoking in the country – and that Wokingham had fewer smokers than any other area.
The is the most fundamental, and most glaring, form of inequality in our society. It’s not just that people in such areas may well be born into poverty. It’s that they arrive in the world with the odds stacked against them. They won’t just have poorer lives than others, but ones that are drastically shorter.
If we want Britons to continue living longer, we need to fix the NHS and social care – for example by finding other ways to get money into the system on top of general taxation, such as insurance or top-up payments, or by setting up a non-partisan Royal Commission to examine its failings and future. We also need, of course, to sustain the growth that pays for the NHS in the first place. But more than that, we need to build an economy that really does, in Theresa May’s phrase, work for everyone – because it is only by delivering genuine mass prosperity that we will give people not just better lives, but longer ones too.
