Anyone who pays even a passing attention to opinion polls will have heard about the margin of error. For those of us who use social media regularly, it’s very often cited by someone trying to downplay a poll move or finding that’s unfavourable to their party or preferred narrative.
But it represents something important – the uncertainty that comes with estimating the levels of or changes in public opinion (or, in fact, anything) from a sample of the population rather than a census. And yet, for all that the margin of error is cited, it remains poorly understood. I’m going to try and demystify it a bit.
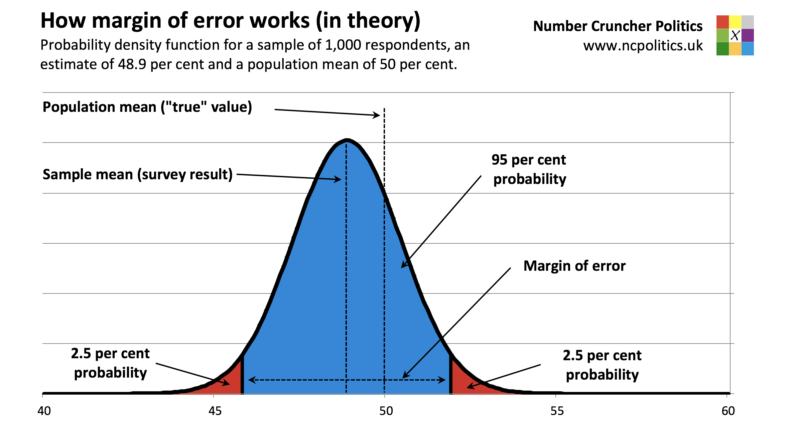
First, what is the margin of error? Here’s an example to explain. Suppose that exactly half the population love Marmite and the other half hate it. If I were to pick 1,000 people at random and ask them whether they love or hate Marmite, then assuming all 1,000 answer (and answer truthfully), then about 500 of them should say that they love Marmite. It might actually be 489 or 507. But even if we didn’t know that the “right” answer were 50 per cent of the population, we’d have a pretty good idea just from the results of this sample.
In fact, it can be shown mathematically that 95 times out of 100, the population mean (the “right” answer) will fall within 3.1 percentage points of the sample mean (the survey result) for a sample of 1,000. In other words, if our sample contained 489 Marmite lovers (48.9 per cent of the sample) we can be 95 per cent sure that they make up something between 45.8 and 52 per cent of the population.
That’s why the unpleasant person sometimes encountered on Twitter saying “There’s no way 1,000 people can be representative of the population” is wrong. A sample of 1,000 does provide this level of accuracy, provided the condition of randomness is met. Larger samples provide greater accuracy, but with diminishing returns. Of course, samples sometimes aren’t representative, but in those cases, it’s because the samples are not random – something that depends on sample quality (and ultimately methodology), not quantity.
It’s also worth remembering that not all points within the range defined by the margin of error are equally likely. For a sample of 1,000, there’s a 68 per cent chance that the truth lies within 1.6 points of the survey result (in other words, half the margin of error).
That’s the theory. But what about the practice? Well, it’s not exactly a secret that in a number of recent elections and referendums, polls have been outside the margin of error rather more often than the 5 per cent of the time we’d expect for a perfect sample.
It’s therefore clear that the margin of error alone cannot account for the uncertainty around estimates of party vote shares. That’s because in addition to random error (which is what the margin of error quantifies), we also have to contend with non-random error.
Real world time and budget constraints mean that perfectly random poll samples do not exist. Samples may not represent the population in ways that matter, even after weighting and adjustments to make them more representative. This was the primary cause of the 2015 general election polling disaster.
And even with a representative sample, it’s hard to identify who is likely to vote. You can ask them, but people aren’t always good predictors of their own probability of casting a ballot, so an alternative is to look at past turnout patterns. Problems in this area have been identified as possible causes for the problems that some pollsters had in 2017. Another potential problem is that the “right” people may give the “wrong” answers.
This is usually more nuanced than people simply lying. At the 1992 general election, a significant component of the polling miss – which remains the biggest of all time at a UK election – was that voters who claimed to be unsure how they would vote broke very heavily for John Major and the Conservatives. Since a large majority of them had voted for Margaret Thatcher in 1987, the suspicion was that many were not genuinely undecided, but had in fact intended to vote Conservative all along – the Shy Tory Factor.
And finally, even if none of these problems arise, and a poll is an accurate snapshot when it is done, people can always change their minds between being polled and polling day. This caused the miss at the 1970 UK election, when most pollsters finished fieldwork a couple of days before the election – a practice which subsequently changed, after it turned out that they had missed a decisive late surge for Ted Heath.
But in some cases, the way the margin of error is used may overstate uncertainty, such as when considering how opinion has changed over time. The calculation here is different, because instead of looking at one poll we’re considering the difference between two polls, but the principle is the same.
You may hear the phrase “changes are within the margin of error” quite a lot. But, in fact, it would be unusual if changes in something like voting intention were not within the margin of error. Unless either the sample size or the swing in public opinion are very large (the latter being a much rarer event than some realise), then changes in public opinion will normally be too small to exceed the margin of error in any frequently-conducted poll.
There are also technical reasons why modern polling techniques have suppressed poll-to-poll variation. It’s an ongoing debate whether these have improved accuracy, but they have clearly reduced polling volatility. For that reason, it pays to consider the trend in polling results, rather than the change between a pollster’s last two data points.
For example, some pollsters haven’t yet produced a change outside the margin of error from their previous poll so far in 2018 – yet all of them show statistically significant changes in support for Labour and the Tories between the start of the year and now.
If all of this sounds complicated, well, this is actually a heavily simplified version of reality. As polls have become more complex, so has quantifying the random error associated with them. This all matters for the way polls are reported. People are right to be cautious about the levels of support indicated by polls, and the true amount of uncertainty. But when it comes to changes over time, poll watchers ought to pay more attention to trends over multiple samples, rather than solely comparing week-to-week or month-to-month variation to the margin of error.
