At the heart of every Budget is what Philip Hammond referred to today as “the spreadsheet bit”. The Chancellor stands at the Despatch Box and recites a series of numbers, to the whoops or jeers of the parliamentary crowd.
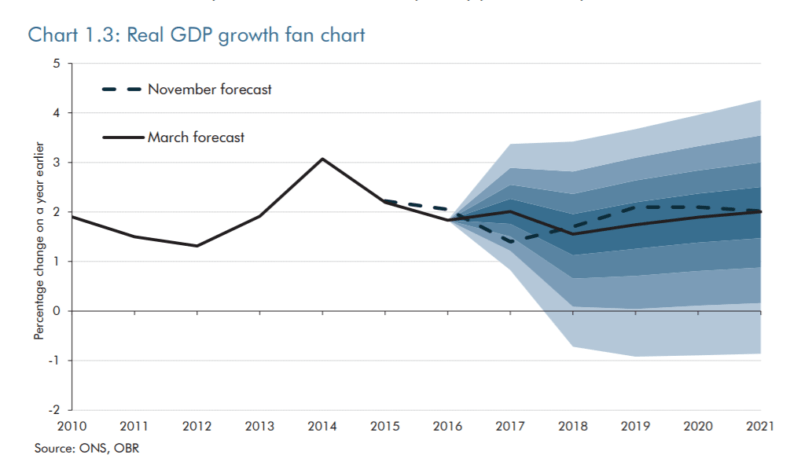
Today, for example, we had this on growth: “Reflecting the recent strength in the economy, the OBR [Office for Budget Responsibility] has upgraded its forecast… this year from 1.4 per cent to 2 per cent. In 2018, growth is forecast to slow to 1.6 per cent, before picking up to 1.7 per cent, then 1.9 per cent, and back to 2 per cent in 2021.”
Next, it was the data on borrowing, which in this instance had been revised down due to “a number of one-off factors”. So, Hammond announced, “the OBR now forecasts borrowing in 2016-17 to be £16.4 billion lower than forecast in the autumn, at £51.7 billion. Then £58.3 billion in 2017-18; £40.8 billion in 2018-19; then £21.4 billion; £20.6 billion; and finally £16.8 billion in 2021-22.”
It’s these forecasts – on growth and debt, borrowing and inflation – which provide the guide rails for the public finances. They’re what all the charts you see whizzing round after the Budget are based on, and much of the commentary, too.
The problem is that they’re all nonsense. Worse than that, they’re dangerous nonsense.
A Budget, and the coverage it receives, is invariably about looking forward: to what the future holds for the economy and for individual taxpayers, and how the Chancellor’s decisions will impact on them.
But to understand what I’m talking about, it’s actually more useful to look backwards – and not just because Philip Hammond kept things so determinedly low-key.
Pretty low key budget from Mr Hammond. So Mr Corbyn seems to be ignoring its contents in his riposte.
— Andrew Neil (@afneil) March 8, 2017
Back in 2010, George Osborne’s first Budget laid out its own vision of the future. He predicted that by 2015, borrowing would have fallen to 1.1 per cent of GDP, and the national debt would stand at 67.4 per cent of GDP, having peaked at 70.3 per cent in 2013/14.
Spoiler alert: it didn’t happen. In actual fact, borrowing last year was 3.9 per cent of GDP – and instead of standing at 67.4 per cent of GDP, national debt was a stupendous 83.6 per cent of it, which works out to approximately £250 billion more than the target.
In fact, according to the forecasts today (assuming they can be trusted), it will top out at 88.8 per cent of GDP in 2017-18. Or, to put it another way, Osborne initially suggested that Britain would owe £1.3 trillion in 2015-16. It has actually ended up owing 23 per cent more.
There have been various narratives put forward about what went wrong – ranging from too much austerity, not enough austerity. But actually, it didn’t have much to do with austerity at all.
In his first Spending Review, also in 2010, Osborne said that the state would spend £740 billion in 2014/15, representing 41.6 per cent of GDP. (While this is a colossal and almost certainly excessive sum, it’s worth remembering that spending had, thanks to the financial crisis, reached almost half of GDP by the time he came in.)
In reality, we actually ended up spending pretty much exactly that – £746 billion. It’s the same story across Osborne’s tenure – even with increased borrowing costs, public spending pretty much kept on track, or at least was only a few billion over his predictions. What went wrong wasn’t so much the spending, but the receipts – not the black line here, but the green one.
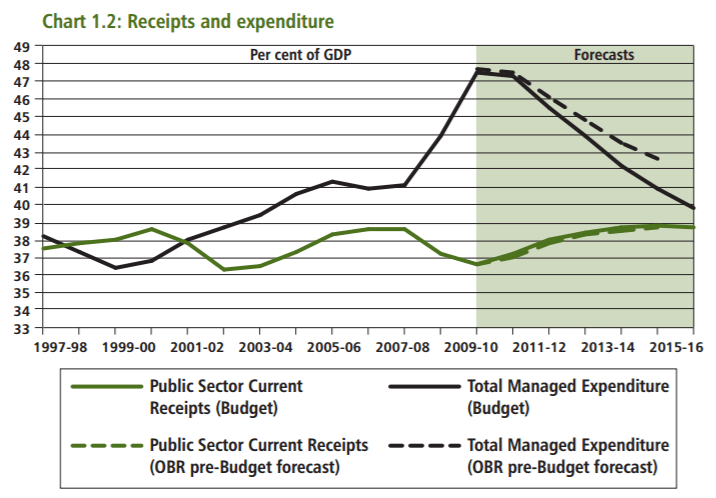
When Osborne stood up in 2010, the assumptions in the Treasury and new Office for Budget Responsibility about the shape of the future looked like this:

Global growth did indeed hit 4.3 per cent in 2010. But rather than staying at that perky level, it slumped to roughly 2.5 per cent, where it’s remained ever since. And because Britain is part of the world, we slumped too. Instead of the figures from 2010 reading “1.2, 2.3, 2.8, 2.9, 2.7, 2.7” they actually went “1.9, 1.5, 1.3, 1.9, 3.0, 2.2”.
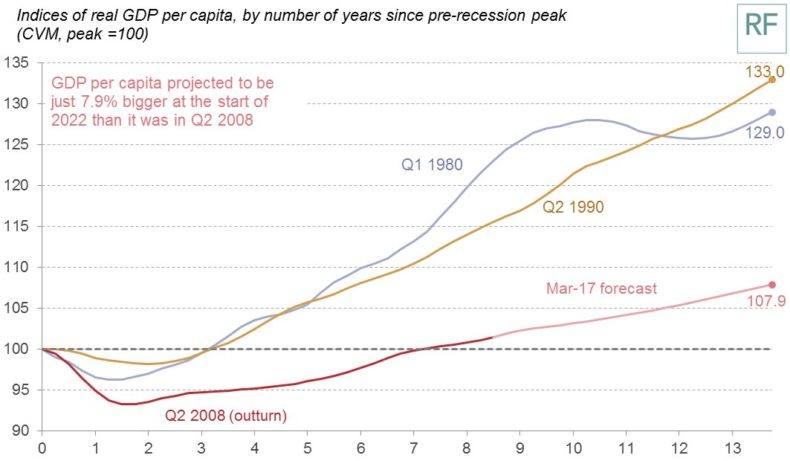
The result – as this chart from the Resolution Foundation shows – was that the economy didn’t so much bounce back from the financial crisis as limp back from it. Real GDP per capita took seven years to hit its pre-crisis peak.
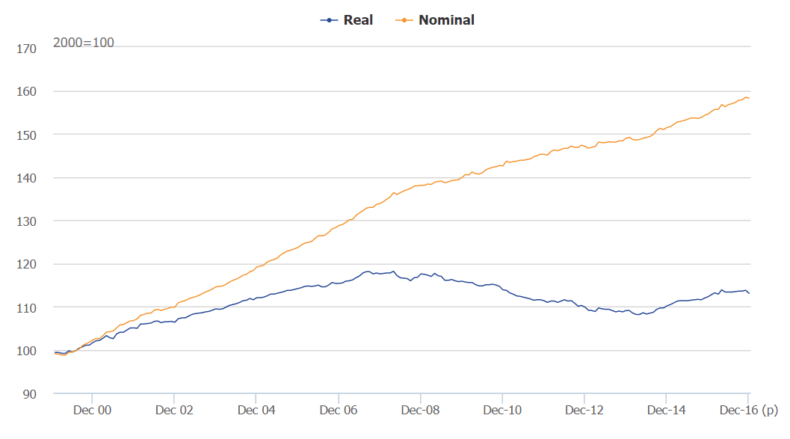
And real wages still haven’t got back to where they were, as this chart from the Office for National Statistics demonstrates. (The saving grace, of course, is that Britain’s flexible labour market has enabled us to trade those lower wages for more jobs.)
The result of all that, of course, was that Osborne’s numbers got hopelessly out of whack. He was spending roughly as many billions as he’d promised – but nowhere near as much was coming in as was hoped or expected, because both GDP and tax receipts were way off base. And so the deficit reduction programme had to be extended for another five years, and possibly even beyond that.
And the big lesson of all this is that Chancellors – whoever they are – simply don’t know what’s out there.
When it carried out a “lessons learned” exercise in the middle of the last parliament, the OBR – which is independent of government – didn’t blame Osborne for what had happened. It said that in 2011, the economy was knocked off course by external shocks: high commodity prices and the euro crisis, which persisted into 2012. Come 2013, when the seas were calmer, the British economy started performing as expected.
And this is why “the spreadsheet bit” is such a problem.
The forecasters at the OBR actually know exactly how woolly their forecasts are, and how provisional their assumptions. Take today’s Budget, for example. Their actual range of forecasts, below, doesn’t look like a neat little row of numbers. It runs the gamut from boom to bust, from rejoicing to recession. Yes, they expect growth to be a bit higher in 2017 than they did back in November, and a bit lower in 2019, but for all their expertise, it’s still a guessing game.
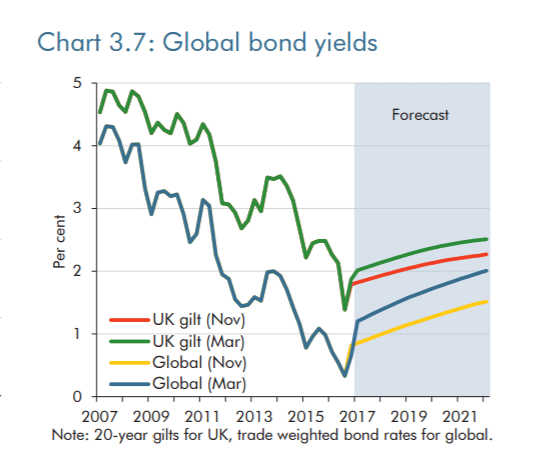
And that’s before you consider what happens with Brexit – a word Hammond, remarkably, didn’t actually use today. The forecast makes no allowances for exit payments to the EU, either one-off or continuing; assumes there will be no financial costs or benefits in terms of payments to Brussels; that Brexit slows the pace of import and export growth; that the UK adopts a tighter migration regime but not overly so; that inflation does this, oil prices do that, and bond yields do the other. The past is all jagged lines, the future all smooth ones.
Yet the Budget documents themselves contain a startling example of how wrong any such prediction can be.
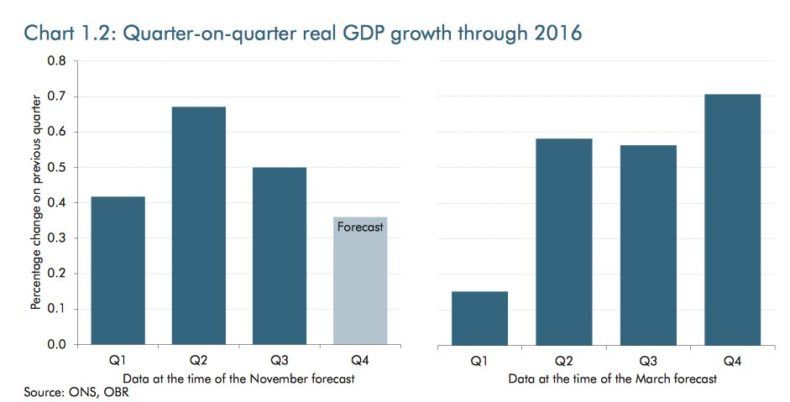
On the left is the OBR’s estimate, from last November, for Britain’s GDP in the last quarter of 2016. On the right is what actually happened. Instead of the prospect of Brexit having a chilling effect, consumers and the economy shrugged it off. The end result was that growth forecasts were half of what they should have been – even while that growth was actually going on. Imagine how wrong they can be with a four-year run-up.
What the Chancellor – any chancellor – ends up offering us is spurious certainty. A certainty which encourages them to take things easy, to postpone difficult decisions until the economy is in the better shape which the spreadsheets promise – or to stretch them out to ease any pain.
And it also ensures, among other things, that government spending will always be set to match those optimistic forecasts – that the size of the state will tend to match what is projected to be affordable, rather than what is actually needed.
Last week, Lord Macpherson, the civil servant who ran the Treasury for Osborne, Alistair Darling and Gordon Brown, pointed out in the Financial Times (£) that over the course of the 34 Budgets he had worked on, Chancellors had tried all manner of wheezes to juice the tax take, or productivity, or Britain’s long-term rate of growth. Pretty much all of them had failed.
So wouldn’t it be better to plan for that world rather than the rosy one of the forecasts? To base spending on the likely tax take, rather than on what Whitehall feels we need to spend (which is, invariably, much higher)? Or even to model the public finances on a lower-than-predicted GDP trajectory (for example, the bottom of the darkest section of the OBR’s fan chart), to give us room to cope with the unexpected?
Or instead, we can stick blindly to the spreadsheets – reducing our flexibility to cope in a world in which surprises are as likely to come on the downside as on the up.

