
Oil prices have fallen by 70 percent in the past 15 months. The price of aluminum, copper, zinc and other important commodities are also falling precipitously. While this recent collapse might be temporary and reverse once the global economy gets its mojo back, it is noteworthy that, on average, commodities today are cheaper than what they were in 1960. Many people have assumed that population growth would lead to the exhaustion of natural resources and mass starvation. In reality, the opposite has happened. A growing population has been accompanied by rising incomes, higher calorie consumption, and declining commodity prices.
Pessimism sells. Take 1972’s The Limits to Growth report by the Club of Rome, which sold 12 million copies in 37 languages for an example. “If present growth trends in world population, industrialization, pollution, food production, and resource depletion continue unchanged,” the report concluded, “the great majority of currently nonrenewable resources will be[come] extremely expensive.”
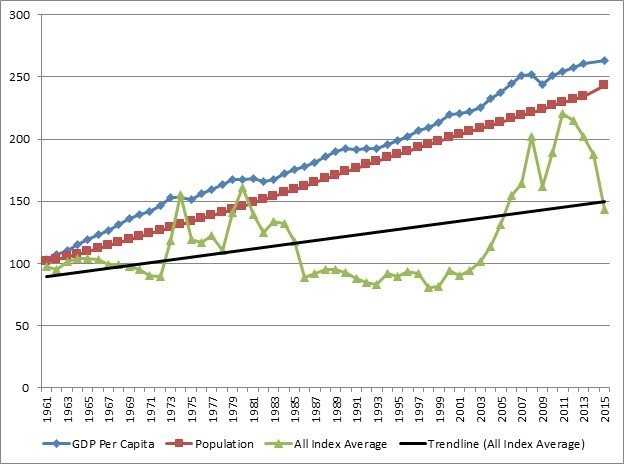
What has happened in reality? Between 1960 and 2015, the world’s population increased by 143 percent. Over the same time period, real average annual per capita income in the world rose by 163 percent and the price of food has gone down by 22 percent. How come? The answer lies in specialization and trade, which has allowed the rise in global population to be translated into increasing global productivity.
Astonishingly, resources that humanity needs in order to survive and flourish have become more, not less, abundant. While we do not know the size of most reserves of natural resources, we can ascertain their scarcity by looking at prices. Counterintuitively, we find that most commodity prices either fell in absolute terms or grew less than incomes.
Out of the 15 indexes measured by the World Bank, 10 fell below their 1960 levels. The indexes that experienced absolute decline included the entire non-energy commodity group (-20 percent), agricultural index (-26 percent), beverages (-32 percent), food (-22 percent), oils and minerals (-32 percent), grains or cereals (-32 percent), raw materials (-32 percent), other raw materials (-56 percent), metals and minerals (-4 percent) and base metals (-3 percent).
Five indexes rose between 1960 and 2015. However, only two indexes, energy and precious metals, increased more than income, appreciating 451 percent and 402 percent respectively. Three indexes increased less than income. They included “other” food (7 percent), timber (7 percent), and fertilizers (38 percent).
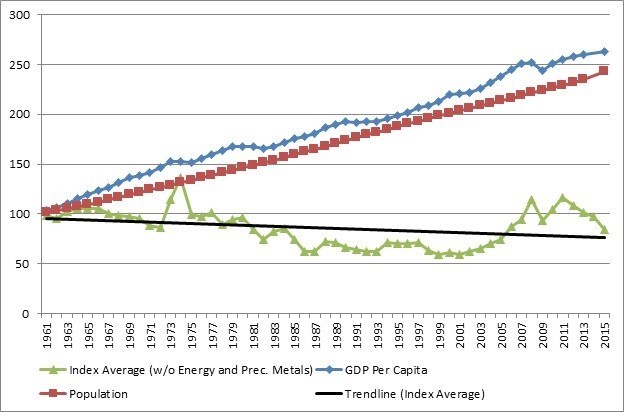
Overall, we find that all index average rose by 43 percent. If energy and precious metals are excluded from our calculations, index average falls by 16 percent. Assuming that an average person spent exactly the same fraction of her income on our list of commodities in 1960 and in 2015, she would be better off under either scenario, since her income rose by 163 percent over the same time period.
All of which was predicted by the contrarian economist Julian Simon some 35 years ago. In The Ultimate Resource, Simon noted that humans are intelligent animals, who innovate their way out of scarcity. In some cases, we have become more parsimonious in using natural resources. An aluminum can, for example, weighed about 3 ounces in 1959. Today, it weighs less than half an ounce. In other cases, we have replaced scarce resources with others. Instead of killing whales for lamp oil, for instance, we burn coal, oil, and gas.
“On what principle is it that when we see nothing but improvement behind us,” 19th century British historian and politician Thomas Babington Macaulay once asked, “we are to expect nothing but deterioration before us?” Whatever the reasons for the persistence of pessimism, exhaustion of natural resources ought not to be one of them.
