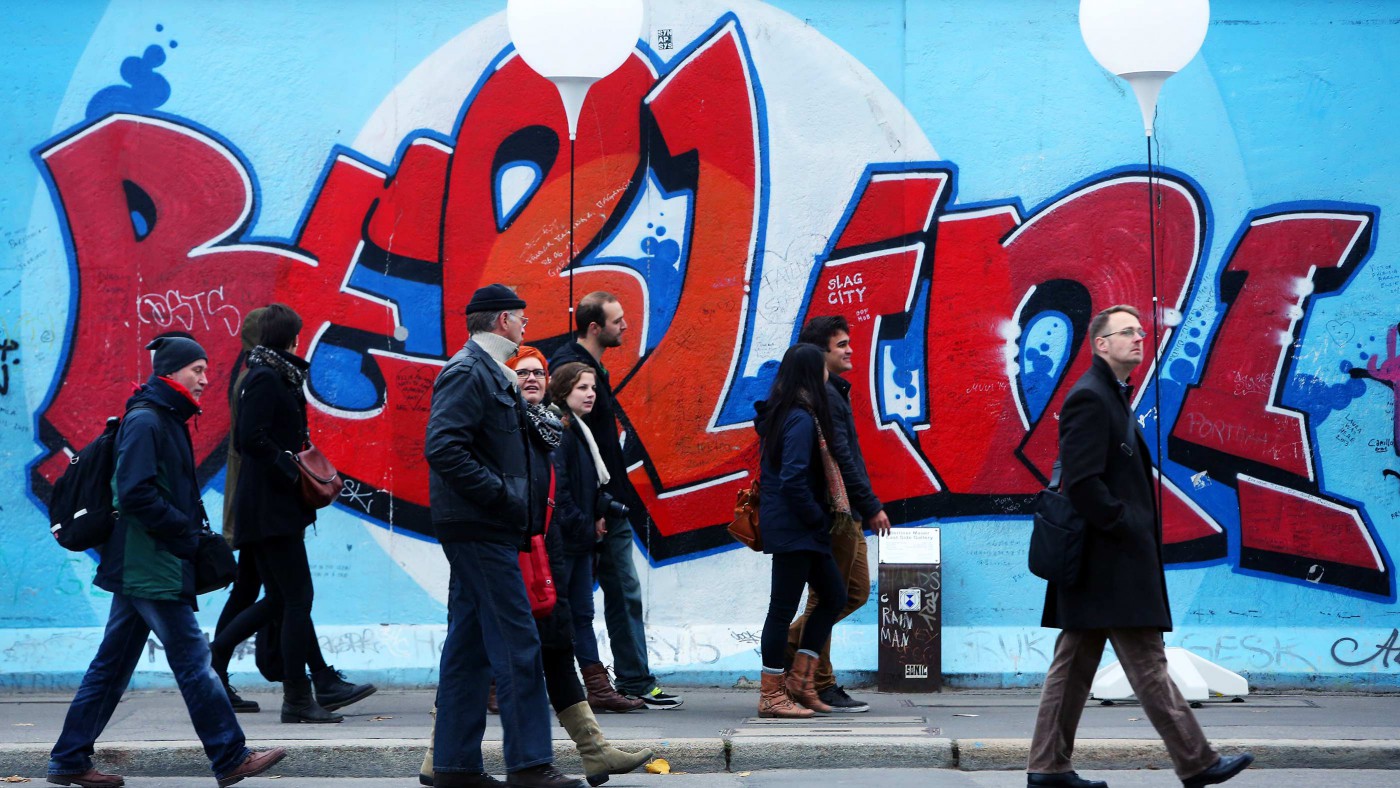
We know that Soviet countries flourished after the breakdown of the Iron Curtain, improving life for millions of people, but exactly how did things change? In an exclusive for CapX, Tim Knox and Adam Memon of the Centre for Policy Studies draw up 9 graphs to explain everything you need to know about life in Eastern Europe before and after the fall of the Berlin Wall.


